Harnessing Event Data: Leveraging Analytics to Drive Event Success
Events can be a massive opportunity for any business. This is true whether you’re hosting an online event like a webinar, a networking event at a local restaurant which is designed by a professional company like I-5 Design Build, or a convention at a major destination.
These events can be hotbeds of activity, helping you gather lead information so you can strategize conversion funnels.
But they also carry another major benefit: analytic data.
Events represent an opportunity to gather data on attendees. This information can help you adjust your company’s overall marketing plan and ultimately shift the planning process for your next event.
There’s so much you can learn by analyzing event data. By gathering, analyzing, and comprehending event analytics, you can inject informed strategic moves into your business marketing moving forward.
But how can you gather event information? And once you’ve collected data from your event, what can it tell you? More importantly, how can that data help your business?
Today’s article will answer all of these questions.
How can you gather event data?
When it comes to driving event success, using analytics to capture data and engagement is essential.
For instance, event organizers can use tools like Hubspot lead scoring to assign scores to leads based on their engagement levels and interactions throughout the event journey. By leveraging this lead scoring system, organizers can identify the most promising leads with the highest scores and prioritize follow-up efforts accordingly.
By harnessing the power of data, businesses can gain valuable insights into their events and make informed decisions to optimize future campaigns. Marketing automation software plays a pivotal role here, as it captures and consolidates data from various sources. These sources may include registrations, attendee behavior, and post-event feedback.
Your CRM can also keep track of the leads your events generate. This data includes how many leads you gathered, how many followed up afterward, and how many converted into paying customers.
Marketers can then evaluate the effectiveness of event strategies, identify areas for improvement, and personalize future interactions based on attendee preferences.
You can also gather data the old-fashioned way.
At an in-person event, simply hand out comment cards and surveys for guests to fill out. If you want more accessible data, send a follow-up email blast to attendees. This reminder email tactic can work for both in-person and online events.
Event attendees will often feel strongly about their experiences. By gathering these opinions, you’ll be able to improve your event planning process and make sure that future events see a positive return on investment (ROI).
What can you learn from event analytics?
Event analytics can tell you a lot about your target audience and how they interacted throughout the entire event.
Here’s what you can learn from event analytics:
Whether your event expenses were reasonable and within budget
Some of the greatest expenses accrued when running an event include the site rental fee and labor costs.

To have a successful event, you need a great planning team and volunteers helping out. While volunteers work for free, event organizers need to train them and distribute assignments. Consider using an online time clock to track volunteer hours and paid help in real time.
This step will help volunteers know their total volunteering hours as well as their ongoing schedules. Additionally, it can help event organizers know which shifts volunteers are working so they can make sure there’s always someone in all areas of the event.
But, more importantly, this can help you understand how many hours your event workers have put in. It’s then a simple matter of determining how that figure eats into the return generated by the event.
The same goes for your site rental. You’ll see a much lower return if the rental fee and associated costs are too high.
Compare data on these expenses to all funds generated through the event to determine how much profit you pulled in. By doing so, you can look for opportunities to cut some financial corners and create a more manageable and fruitful profit margin.
What elements made an impression
By polling your event attendees, you can understand what they liked and didn’t like. This can encompass everything from the content you offer to the way you decorate your in-person events, and more.
For instance, if you hired a flower delivery service to save time sourcing, arranging, and transporting flowers to a bridal conference, you could ask event attendees for feedback on the arrangements.
If comment cards and guest surveys indicate that the arrangements were too fragrant when used on dining tables where guests were eating, then you can opt for fragrant-free alternatives in the future. Or, if attendees rave about your orchid centerpieces, you can double up on orchids at the next bridal event.
The same goes for content. If your data indicates that the event’s keynote speaker went unappreciated, you might consider inviting new guests in the future — or polling prospects to uncover who they’d like to see.
By learning what your event attendees liked or didn’t like, you can personalize future events with them in mind, creating a truly optimized experience for your target audience.
Are you attracting the right guests?
Using a marketing automation platform like a CRM gives you a good sense of whether the guests who attended your event were profitable.
For instance, let’s say your event brought in rave reviews.
The attendees were floored and encouraged by everything from your speakers to your networking opportunities and decor. The feedback is in, and you were a massive hit from a guest satisfaction standpoint.

Then, a few months later, you check out the leads generated through this event. That’s when you realize your conversion rate is far lower than anticipated. ???? That means your event ROI is low, and you might have even lost money.
This analytic data may suggest that the people who attended:
- Had no need for your offer
- Couldn’t afford your services
- Didn’t see the value in your offer
- Didn’t respond well to your sales team’s follow-up efforts
Somewhere, a wire got crossed. Either you targeted the event’s marketing to the wrong people, didn’t personalize the guest experience, or your sales pitch system needs a revamp.
Without this analytic data, you might have never known the extent to which your event didn’t meet expectations. Armed with these points, you can change your targeting parameters for marketing and shift your pricing and approach accordingly.
How much business came from the event?
The goal of most business events is to gather leads and close deals. The networking opportunities created at events open that potential door and help you reach the right people.
The analytic data gathered from your event can show you exactly how many actual dollars came from it. This figure ultimately helps you make decisions based on profitability.
For example, if expenses far outweigh profits, that doesn’t necessarily mean the event was a failure that should never happen again. It may just mean that you need to structure future events differently.
For instance, if you know that your event cost $10,000 to run but only generated $8,000 in revenue, you have a benchmark to work from.
Next year’s event should keep that $8,000 front of mind. When planning the event, consider choosing a smaller venue, more affordable speakers, and fewer staff members. This data-driven planning should bring your expenses under that $8,000 goal.
Then, examine the return generated by that next event to see if it’s less than, more than, or equal to $8,000.
If there’s a decline in revenue, you’ll need to figure out why. Were there fewer attendees? Did changing the venue or speaker panel bring in a different crowd? Get into the nuts and bolts to see what led to the loss. Then, course-correct accordingly until you’ve reached your event ROI “sweet spot”.
Where are your attendees coming from?
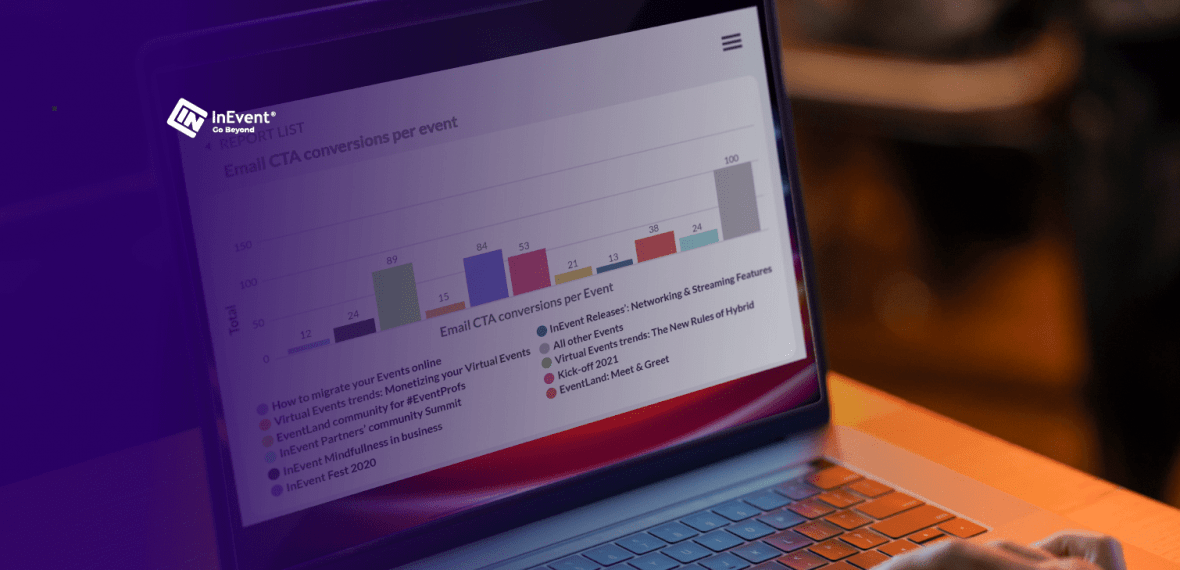
Analytic data can help you identify profitable event lead sources. *Hint: Your attendees list should include a section that describes where they first heard about your event.
Consider compiling this data into a graph to get a more complete view:

If you see that Facebook ads, for example, drew in a massive crowd, but you saw very little success from email marketing, siphon some of the funding away from email and pour it into your Facebook marketing budget instead.
By keeping a close eye on where guests are coming from, you can put more eggs in those baskets to encourage higher attendance.
Wrap up
Whether you’re holding a small virtual event or an in-person networking extravaganza, you’ll need to consider analytic data when planning your guest experiences.
The data you compile can reveal a lot about your target audience, their marketing preferences, and the quality of the leads generated. Gather as much data as possible, and you’ll guarantee that all future events will have the highest probability of success.
And speaking of success …
Here’s to yours!
PS: Looking for event management software you can use to plan, manage, and analyze all of your events? Get ready to be obsessed with InEvent. Schedule your free demo, today.
The author Kelly Moser is the co-founder and editor at Home & Jet, a digital magazine for the modern era. She’s also the content manager at Login Lockdown, covering the latest trends in tech, business and security. Kelly is an expert in freelance writing and content marketing for SaaS, Fintech, and ecommerce startups.
About the Author / Ana Almeida
You might also like
-

What is an Event Management Software? Types, Benefits, and Features.
-

Event Participant’s Onboarding Checklist
-

Creative Workshop Ideas For Corporate Events – 2024
-

Everything You Need To Know About Global Meetings Industry Day (#GMID2024).
-

How does AI Help in Creating Slogans for Events?
-
8 Event Management Skills You Must Know in 2024
-
Emerging Event Industry Trends in 2024
-

Top 10 Travel Trade Events Worth Visiting in 2024
-

Hybrid Events: Bridging the Gap Between In-Person and Virtual Experiences


